22/08/2022
IBA's ESG Consultancy experts use IBA NetZero to regularly track the CO2 efficiency of the global commercial aircraft fleet.
Based on a variety of metrics, we can understand the factors that define the efficiency of aircraft, and lead to regional trends in efficiency improvements.
IBA is uniquely positioned to help you navigate the evolving world of aviation environmental and social governance (ESG). From emissions monitoring and forecasting to ESG strategy and ratings, our ESG consulting services equip you with independent third-party intelligence, and the tools you need to succeed.
Learn more about ESG Consulting
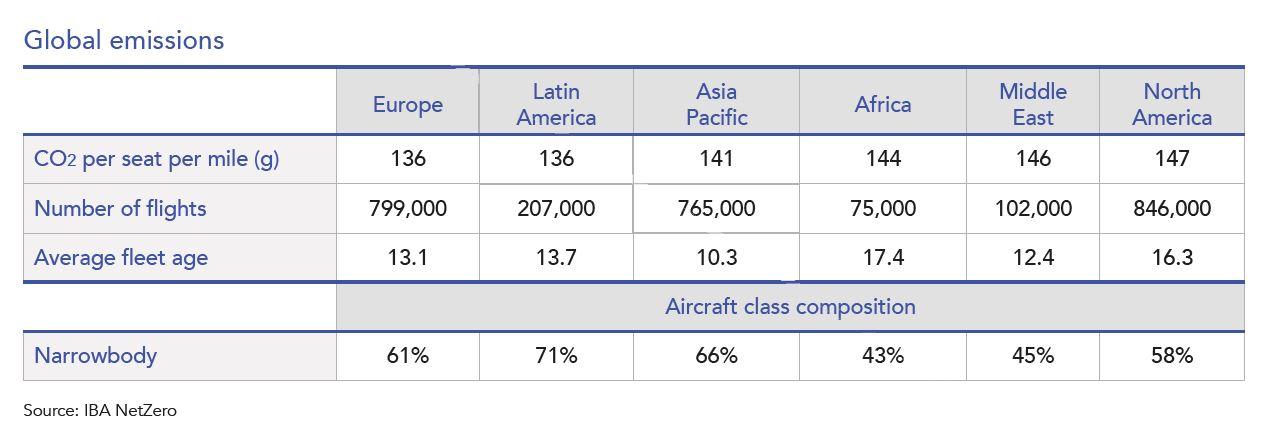
The global fleet efficiency is driven by a variety of different aircraft and mission types across a broad range of routes and aircraft configurations. Our latest intelligence reveals that the Europe and Asia Pacific regions contribute over 1.5 million flights to the global mix and are leading the improvement in global efficiency. Africa, the Middle East and North America are driving the lowest improvements. There are 3 key factors are driving these trends.
The average age of the global commercial aircraft fleet is a major driving force behind efficiency. IBA Insight reveals the global average fleet age to be 13.5 years. The Europe and Asia Pacific fleets are on average 13.1 and 10.3 years old respectively, whilst the oldest global fleets are in North America (16.3 years) and Africa (17.4 years).
Another key driver in regional efficiency is the mix of prolific aircraft types in that region. A higher proportion of regional jets and turboprop aircraft will drive down overall efficiency on a per-seat per-mile basis. Fleet data from IBA Insight shows that 12.6% of the fleet in Europe and CIS are regional jets. This is 37% higher in North America, where such aircraft make up 17.2% of the fleet. Not only is North America's efficiency negatively impacted by the proliferation of the regional jet, it is also hampered by scope clauses limiting the MTOW (maximum take off weight) of aircraft permitted to fly certain domestic routes. This limits the introduction of more efficient, new generation regional jets such as the Embraer 190/195 E2.
Airlines that operate higher density aircraft are more efficient on a CO2 per-seat per-mile basis. As legacy and flag carriers tend to operate mixed configurations, regions with higher numbers of such operators are typically less efficient. A key example is the Middle East region. Whilst having the second-youngest fleet in the world, the region is dominated by state-owned full-service carriers, with a focus towards opulent first and business class products. This contributes to a higher CO2 per seat-per mile than regions with a higher proportion of low cost and ultra-low cost carriers.

IBA NetZero is the most advanced finance-focused carbon modelling tool currently available; we're leading the way. It's powered by IBA's proprietary fuel-burn intelligence which, when integrated with the Flights and Fleets module, can illustrate carbon emissions by any combination of: time period, airline, lessor, aircraft MSN and model, fleet, future portfolios, OEM, country, airport and route pair.
Related content