13/04/2022
IBA has published its latest aviation Carbon Index in partnership with KPMG. Our latest analysis for March 2022 includes a spotlight on regional aircraft lessors.
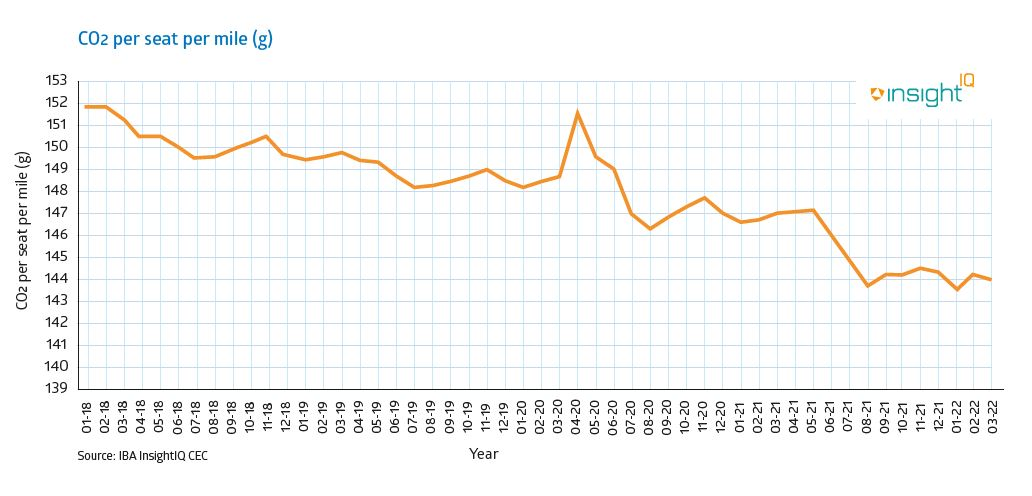
CO2 emissions from commercial aviation averaged 144 grams of CO2 per-seat-per mile in March 2022, with overall carbon intensity per seat decreasing by just under 0.1%. This represents a 2% reduction in CO2 intensity per seat per mile year-on-year.

March 2022 saw a rebound in aircraft utilisation compared with the previous month, despite reciprocal airspace closures and overflight bans between the Russian Federation and numerous Western nations. International flights are the key driver behind the increase in utilisation. International flights have grown by 19% month-on-month globally. Aviation intelligence from IBA's InsightIQ shows that Europe and North America has experienced the largest increase in flight volumes, with a 20% increase in international flight volumes attributed to Europe, and 19% for North America.
Domestic flights have also continued to rebound, growing by 4.9% globally month-on-month. The largest domestic market growth in March was seen in North America, where a total of 94,000 more flights were operated compared to the previous month.
The attention on novel sustainable technologies beyond SAF is heating up. Our latest long-term model forecasts over half a million mostly electric *Short and Vertical Takeoff and landing (‘STOL and VTOL') aircraft may be in service by 2050, in addition to around 8,000 conventional takeoff aircraft that are hydrogen, hydrogen fuel cell, electric or hybrid powered. That said, such new technologies would still only account for around 15% of the global commercial fleet (or 6% of global commercial fleet's energy consumption). In the near future, that brings us back to the importance of SAF, fuel burn efficiencies, and the elephant in the room… contrails.”
Chris Brown - KPMG Ireland.
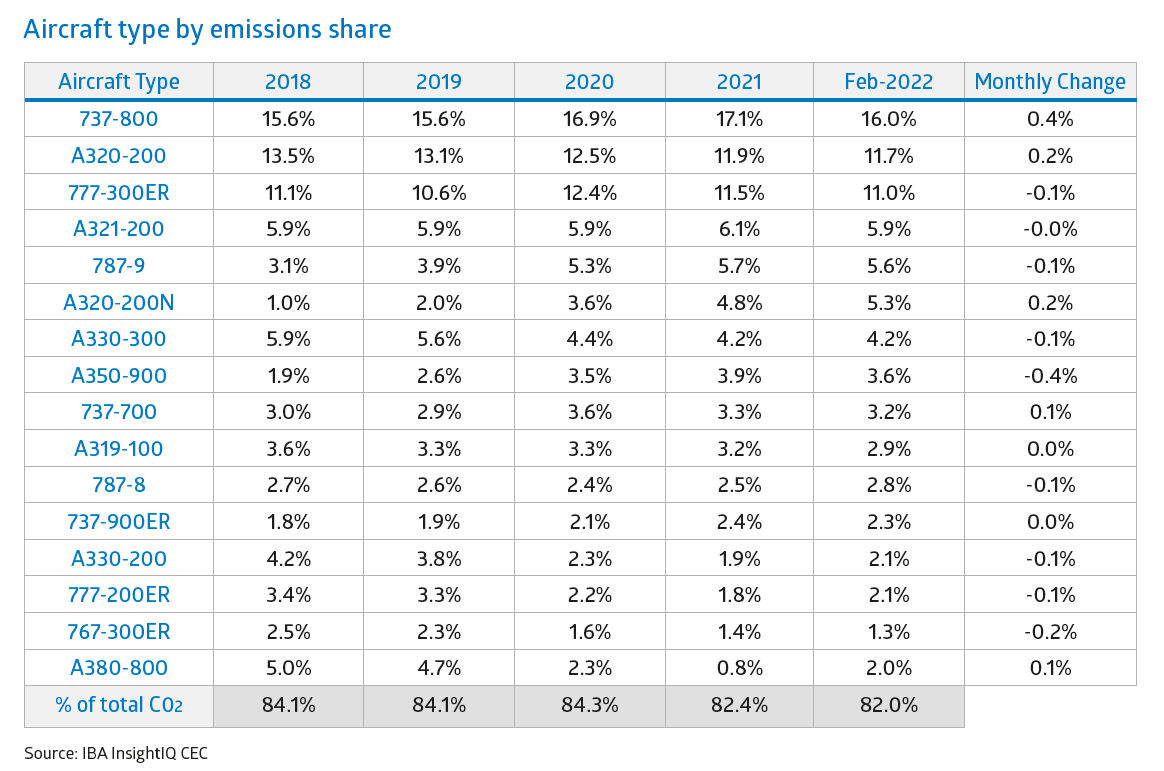
A notable increase in flights from the most popular types in the global commercial aircraft fleet has driven sizeable changes to our aircraft efficiency ranking this month.

Despite a 1.7% increase in utilisation, the emissions share of the Boeing 737-800 reduced by 1.4% in March 2022. Intelligence from IBA's InsightIQ flights module reveals this is largely driven by growth elsewhere in the global fleet mix, with aircraft such as the Airbus A220-300, A321-200neo LR and Boeing 737 MAX 8200 seeing an increase in utilisation of 26%, 35% and 44% respectively. IBA expects the emissions share of these new generation aircraft to increase in the future as aircraft deliveries ramp up. Russian-built jets have experienced a drop in utilisation in March 2022, with the Sukhoi Superjet seeing the most notable decrease of 6%.
Air Seychelles has entered the ranking of our most efficient airlines based on CO2 per-seat per-mile in March 2022. The airline operates two Airbus A320neo aircraft powered by CFM LEAP-1A26 engines. These aircraft are managed by Air Lease Corporation and CDB Aviation Lease Finance, and flew a total of 81 flights collectively in March 2022. The other operators in our ranking remain the same as in our previous index in February 2022. Scoot operated 1,728 flights across 43 aircraft in March. InsightIQ reveals this to be the highest of any airline in our ranking. Smartwings operated a total of 1,175 flights across its fleet of Boeing 737 NG & MAX family aircraft in March.
.png)
Co2 emissions in the lessor space have decreased by 1 gram per-seat per-mile on average in March 2022. Overall utilisation of the assets within the lessor portfolios drove an increase in CO2 intensity across all major lessors throughout February 2022 but tend to ebb and flow based upon the route patterns as well as the time and distance flown.

Analysing utilisation patterns for CDB Aviation Lease Finance's portfolio shows there was a 9% month on month increase in flight volumes, however total flight distance decreased by 1%. CDB's CO2 intensity per seat per mile reduced by 3 grams in March 2022, which was largely driven by a steep increase in new generation jets. The Airbus A320-200 Neo saw an increase of 17%; totalling over 4,300 flights. Similarly, utilisation from the Boeing 737 MAX increased by 15% totally over 3,500 flights. The largest utilisation increase within CDB's portfolio is from the A321-200NX with a 45% increase with the main operators being Wizz Air who took delivery of two aircraft in March 2022. New deliveries and utilisation trends are key in influencing CO2 intensity but generally nominal changes in the figures month on month. More significant changes would be brought about by aircraft deliveries and fleet exits. Whilst there have been no major deliveries or exits in recent months, IBA's expert team will continue to monitor and report on such changes and their impacts on CO2 emissions. Jackson Square Aviation remains at the top of our ranking of the most efficient lessors based on CO2 emissions per-seat per-mile.
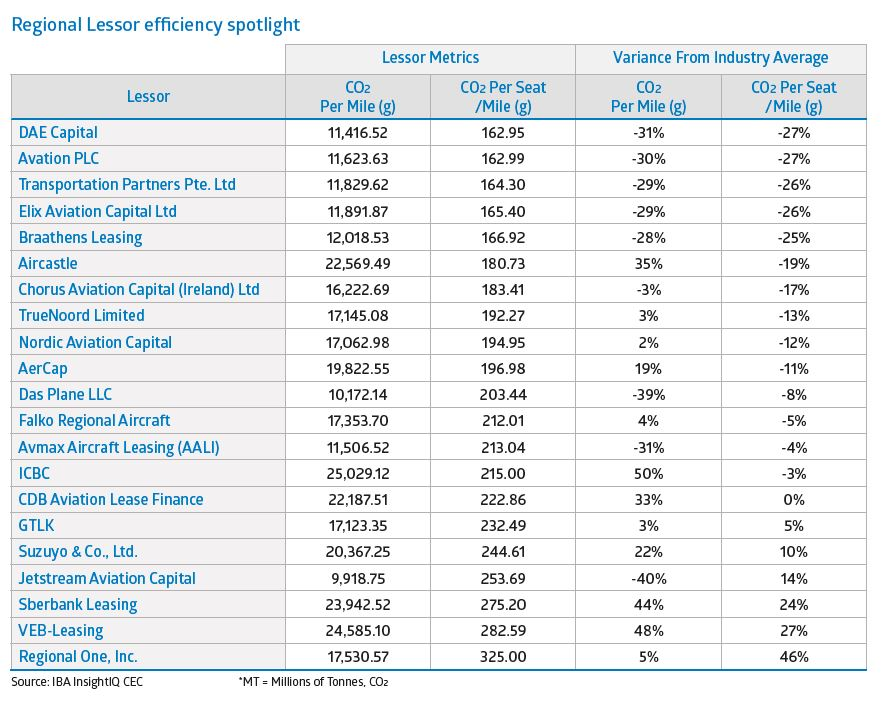
In this month's extra spotlight feature, IBA has focussed on benchmarking and comparing the aircraft leasing companies that specialise in regional aircraft or feature regional jets within their portfolios. Regional jets and turboprops represent an integral part of the aviation ecosystem; increasing the intramodality between airports, feeding hubs, and serving smaller communities around the world.

DAE Capital rank as the most efficient lessor of regional aircraft, with CO2 intensity around 27% below the regional aircraft average on a per-seat basis. This is primarily driven by their Turboprop focus for regional aircraft. DAE currently own over 50 ATR72-600 aircraft, and currently have no outstanding aircraft orders, according to InsightIQ.
The regional aircraft specific lessors such as Chorus Aviation Capital, Truenoord Limited, Nordic Aviation Capital and Falko Regional Aircraft sit towards the top of the rankings, and represent a more realistic CO2 intensity for a regional leasing business. This is due to a large blend of assets within their respective portfolios. Chorus Aviation Capital ranks higher due to 68% of their assets being Turboprops. Truenoord Limited has a more balanced asset split between with regional jets making up 53% of the portfolio.
As ever, context is key, and there are 2 inherent differences to consider when looking at the CO2 intensity of regional aircraft compared to their larger counterparts.
Regional aircraft have fewer seats, meaning emissions per-seat per-mile are generally higher than narrowbodies
Regional aircraft are typically ‘mission specific'. They will generally fly shorter sectors at lower altitudes, and therefore spend less time in the cruise phase of flight, where most CO2 intensity benefits lie.
Regional Jets
The regional jet market is somewhat saturated with previous generation aircraft in major territories, with limited introduction of new generation aircraft. This is particularly true in the North American Market, where newer (and larger) jets are hampered by scope clause restrictions. These clauses limit regional jets to a maximum take-off mass of 86,000 lb. New generation aircraft such as the Embraer E175-E2 breach this limit (largely thanks to its heavy P&W PW1715G engines), resulting in no orders for the aircraft in this market. Some operators have instead opted for the scope clause compliant Embraer E175-E1, with a total of 58 orders for the type since 2020.
Despite this, Embraer's E2 jet family currently holds the largest market share amongst new generation regional jets, with 30 Embraer E195-E2 and 13 E190-E2 aircraft in active service globally. The E2's main competition comes from Airbus A220-100 and -300. The Airbus A220-300 is proving a particularly attractive asset, as it competes with the smaller traditional narrowbodies like the Airbus A319 and Boeing 737 MAX 7. IBA's experts will continue to monitor the competition between these two leading new generation regional aircraft in the coming months.
Turboprops
ATR and De Havilland Canada dominate the turboprop sector. ATR holds a 45% market share over De Havilland Canada's 38%. Whilst turboprops face similar challenges in terms of CO2 intensity on a per-seat per-mile basis, they are largely much more efficient over short sectors when compared to narrowbodies and regional jets.. On routes between London airports and the Channel Islands, ATR and De Havilland Canada aircraft present substantial improvements in efficiency when compared to the Airbus A320-200ceo and Embraer E195-E1.
IBA's aviation Carbon Emissions Index is powered by our Carbon Emissions Calculator, part of InsightIQ. We regularly update the functionality of InsightIQ to give our users the most diverse aviation intelligence and insight. Our latest update adds selection of ‘Engine Model' in the main panel of our Carbon Emissions Calculator, allowing you to aggregate flights to engine model rather than specific aircraft.
IBA's InsightIQ analysis platform flexibly illustrates multiple asset, fleet and market positions, actual and potential, to inform client choices and identify acquisition opportunities. Immediate access to crucial aircraft, engine, lease rate and fleet data eases appreciation of historic and future aircraft concentrations and operator profiles.
Related content
British Airways has taken delivery of UK-made Sustainable Aviation Fuel from Phillips 66 Limited