27/10/2021
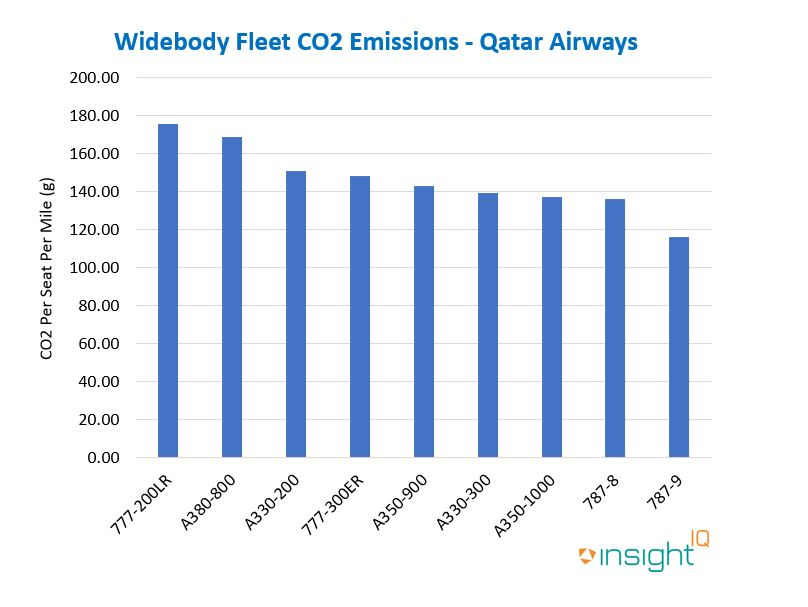
Using data from IBA's InsightIQ Carbon Emissions Calculator, we demonstrate a CO2 emissions analysis for the widebody aircraft fleet of Qatar Airways.
InsightIQ allows you to render a clear, visual representation of fleet wide carbon emissions data. Based on the effective metric of grams of CO2 per-seat per-mile, our aviation Carbon Emissions Calculator 'CEC' reveals the Boeing 787-9 is the most efficient widebody aircraft in the Qatar Airways fleet. The 787-9 produced on average 115 grams of CO2 per seat mile during pre-pandemic operations in 2019, representing a 34% reduction on a per-seat-per-mile basis compared to the Boeing 777-200LR (the least efficient aircraft in the ranking). Whilst newer generation aircraft appear at the top of the list, the Airbus A330-300 can be identified as an outlier. According to the CEC, the Qatar A330-300 fleet averaged 140 grams of CO2 per seat mile, compared to approximately 143 grams for the more contemporary A350-900.

However, data alone doesn't always tell the full story. That's why IBA's team of expert analysts are here to provide additional context to the outputs of our Carbon Emissions Calculator, turning aviation data into aviation intelligence.
In fleet analysis, it is important to consider aircraft configuration when using metrics such as CO2 per-seat per-mile. Variations in class and density will mean the number of seats per aircraft varies, and therefore so does CO2 per seat mile. A higher density aircraft will have a more positive CO2 per-seat per-mile figure. Qatar Airways' A330-300 aircraft are configured in a higher density than the A350-900, with the A350 typically having more premium seats. This explains the A330-300 ranking better than the far newer A350-900. Further analysis using the InsightIQ flights module can reveal which sectors these aircraft are operating, and provide further context to aviation Carbon Emissions data.
IBA also now produces a monthly aviation Carbon Emissions Index, ranking the top-performing aircraft types, airlines and lessors by CO2 per-seat per-mile.
The Carbon Emissions Calculator allows you to easily analyse CO2 emissions across real and hypothetical aircraft fleets, using the effective measure of CO2 per-seat per-mile.
There are clear benefits of newer generation aircraft, but a modern fleet alone isn't a golden ticket to CO2 reduction.
Context is key. Understanding aircraft configuration is key when performing an analysis of aircraft on this basis.
Aircraft with lower density cabins and a greater proportion of business and first-class cabins will exhibit a higher CO2 per-seat per-mile figure.
IBA's InsightIQ analysis platform flexibly illustrates multiple asset, fleet and market positions, actual and potential, to inform client choices and identify acquisition opportunities. Immediate access to crucial aircraft, engine, lease rate and fleet data eases appreciation of historic and future aircraft concentrations and operator profiles.
Related content