24/03/2022
Using IBA's own aviation carbon emissions calculator, and insights from our ESG Consulting team, we examine the profitability and CO2 implications of the transatlantic narrowbody against widebody types.
分享这篇文章
Recent years have seen the emergence and growth of a new player in the transatlantic market - the long-haul narrowbody. IBA has observed a range of operators deploying narrowbody aircraft on major transatlantic routes, competing directly against the traditional network carriers that typically operate a blend of widebody aircraft. This trend has been largely enabled by the emergence of efficient, long-range versions of existing aircraft, such as the A321neo LR/XLR and some Boeing 737 MAX models.
There is an expectation for new generation aircraft to drive improved efficiency of decarbonisation efforts, compared to current generation counterparts. The latest aircraft models typically exhibit an approximately 15% increase in efficiency compared to their predecessors. This improvement in efficiency is expected to yield significant cost savings by the year 2025.
Of the new generation aircraft, the Airbus A321neo is projected to experience the highest compound annual growth rate (CAGR) per aircraft from 2022 to 2025. With an estimated growth rate of nearly 50%, the A321neo is anticipated to gain even more traction among operators. This surge in popularity can be attributed to its robust order book and delivery pipeline, both of which are bolstered by its impressive performance and fuel efficiency.
Therefore, the cost per kilometre (and resultant CO2 per kilometre) of operating an Airbus A321neo LR variant on mature transatlantic sectors represents significant benefits when compared to both current and new generation widebody aircraft. However, understanding the true profitability and efficiency of narrowbody aircraft on transatlantic routes requires context and a careful selection of metrics.
![]()
Source: Air Transat
The profitability of the transatlantic narrowbody is broadly influenced by four key factors:
The inherent lack of space provided by a narrowbody aircraft compared to a widebody results in a costly disparity between space for high-yield premium and business class seats. This results in lower margins for carriers in an already tough climate.
Recent sanctions on Russian oil have made oil prices an even more notable driver in profitability for operators. IBA's analysis shows that fuel accounts for over 50% of the total fixed costs per hour on new-generation narrowbody and widebody aircraft in the current climate. There is an inherent risk in operating narrowbody aircraft on saturated transatlantic routes, such as John F. Kennedy International Airport (JFK) to London Heathrow Airport(LHR), due to a notable disparity in profits.
On average, profits from a widebody aircraft on a transatlantic sector can be 30-55% higher than a narrowbody. Despite this, it is important to understand such differences assume 100% load factors. Operators could find it easier to ensure such load factors on smaller narrowbody aircraft, reducing that gap.
Passengers have moved to a trade-off between comfort and cost. This effectively means it is much easier for a low-cost-long-haul operator to fill a narrowbody aircraft. This maximises ancillary revenues on longer sector lengths compared to a widebody operator when the direct cost to the passenger is 25% lower than that of the competing network airline.
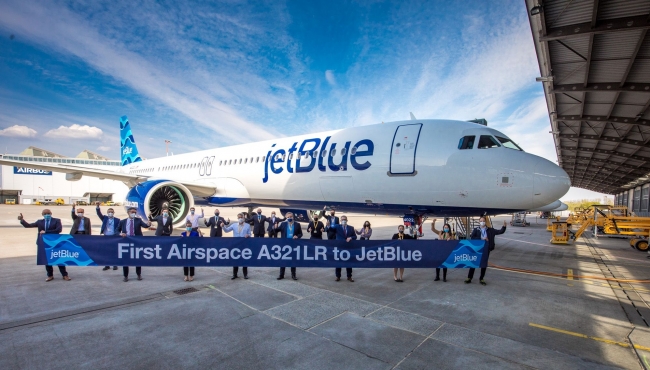
Operators such as JetBlue, TAP Portugal and SAS have identified a gap within the transatlantic market, and aim to maximise load factors by offering seats at prices more than 25% lower than other carriers. They can do this whilst utilising their existing short-haul fleet. Pre-pandemic, the JFK-LHR route was operating at around 84% load factor. Assuming it is easier to fill a narrowbody when compared to a widebody on this route given the current climate, profit margins come out comparatively even across the two aircraft classes.
Essentially, the biggest opportunity for narrowbodies such as the A321neo LR lies in operating long, thin routes that would be unprofitable if operated by widebodies.
Using intelligence from IBA NetZero, we have identified the most efficient widebody and narrowbody aircraft operated by some key players in the transatlantic market. The overall CO2 per pax/km is directly influenced by the seating layout for each airline hence we have based our results off this. Overall, with the trade-off between high-density seating layout (C12 Y187) aboard the Montreal-based Air Transat A321neo LR results in impressive efficiency figures. JetBlue's blend of premium economy and business class seating (C24 Y114) places it in the middle of the rankings and stands in contrast to the more business class-oriented product aboard British Airways' Boeing 777-300ER fleet (F14 C56 W44 Y183). We recently took a look at JetBlue's entry into the transatlantic market and the market share of key competitors.

Each month, IBA’s ESG Consulting team share key insights and the latest news from the growing world of sustainable aviation. Follow us on LinkedIn to see the latest edition. IBA also tracks the scope one CO2 emissions of all major commercial aircraft as part of our regularly updated Aircraft Market Intelligence Reports.
IBA NetZero is the most advanced aviation finance-focused emissions analytics suite available. Our in-built CO2 calculator gives you the power to understand the risks and opportunities associated with decarbonising commercial aviation.
IBA House, 7 The Crescent,
Leatherhead, Surrey KT22 8DY