13/08/2020
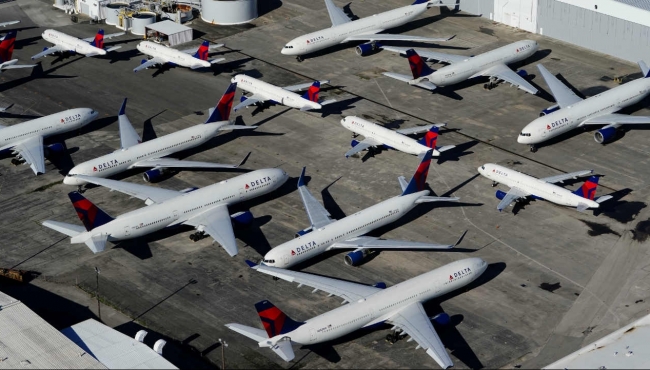
In recent years, the number of aircraft involved in lease end transactions has been increasing in line with growth of the global aircraft fleet. The volume of aircraft connected with operator failures has also risen over the last couple of years.
分享这篇文章
In recent years, the number of aircraft involved in lease end transactions has been increasing in line with growth of the global aircraft fleet. The volume of aircraft connected with operator failures has also risen over the last couple of years.
So far in 2020, we have seen the greatest ever number of operator cessations as a proportion of all lease end events. Peaks in airline bankruptcies typically coincide with economic crises; as the chart below shows, aircraft involved in operator failures peaked after 9/11, during the global financial crisis (GFC) and have seemingly started to peak again in 2020. General economic downturns and airline mismanagement related failures (for example Kingfisher and Malev) also contributed to peaks in 2010 and 2012.

With increased market supply, financiers may be curious to learn how long it will take for aircraft to be placed on a new lease or sold. Using historical lease end and aircraft placement data on IBA.iQ, IBA explores the effect of crises on aircraft downtime between transitions.
The following chart shows that, largely, the average downtime for lease end aircraft has been decreasing since 2010. Before this there were increases between 2000 (one year prior to 9/11) and 2001 from 165 days to 350 days and during the period 2006 (one year prior to the GFC) to 2010 from 130 days to 250 days. This trend remains true for aircraft placed after an operator failure, the average downtime for these increased from 250 days in 2000 to 495 days in 2002 and from 150 days in 2006 to a peak of 535 days in 2010.

This analysis provides three significant insights:
On average, downtime takes approximately five years to regress to the mean of 180 days for the 1999 to 2019 period.
Notwithstanding the different circumstances of the 9/11 attacks and 2008's GFC, the industry appears to be placing aircraft significantly more quickly. The average downtime fell by 100 days between the two crises.
Aircraft placed after being involved in unscheduled lease ends or operator failures took approximately 10 to 13 months to be sold or leased to a new entity.

Lastly, we perceive some aircraft types appear to perform slightly better, taking fewer days to place. The chart below shows that, over the 20-year period, the Airbus A320ceo and the Boeing 737-300 have performed similarly in their average downtime days, with the Boeing 737-800's performance slightly better. The data should, however, be tempered by the relative age of each aircraft type's programme; the Boeing 737-800, having first been delivered in 1998, was relatively young compared with the A320ceo's first delivery in 1988. This difference is perhaps greatest in the most recent five-year period, during which the Airbus A320ceo had an average downtime of 60 days while the Boeing 737-300 and 737-800 were both down for around 78 days.

To conclude, it takes approximately five years after an external shock to the industry on average for aircraft downtimes to regress to the mean. Industry performance does appear to be getting better, aircraft placement times are generally trending downwards. Also, different aircraft types display diverse average mean downtimes, with newer type programmes being absorbed more quickly.So far in 2020, we have seen around 10% of the 220+ aircraft involved in operator failure transactions being moved on to a new operator (although the new operator is usually an affiliate airline). This compares with 30% placement for non-operator failure lease ends. While the Covid-19 pandemic is unprecedented and unique, if countries are able to put in place clear and unambiguous travel guidelines, we anticipate this will go some ways towards maintaining the previous trend. Precise procedures will remove some of the uncertainty driving low demand and allow lessors and operators to feel confident when repositioning aircraft, thus supporting reduced downtime.
On the other hand, predictions that traffic will be depressed until 2024 hint towards a significantly more nuanced market, where expertise in remarketing and insight into the latest downtime trends by aircraft type will be key in helping to place aircraft quickly and efficiently.
If you have any further questions, comments or feedback please contact Marlon Tull, IBA's Senior Aviation Analyst.The data used within this analysis was derived from InsightIQ, our leading online data intelligence platform. See the system in action.
Diligent asset management and proven expertise in remarketing are essential to the minimize downtime days.
For more information on how IBA's global Asset Management and Technical teams can support your business please contact Peter Walter
IBA House, 7 The Crescent,
Leatherhead, Surrey KT22 8DY