IBA Weekly  Download to PDF

Date: 07/07/2023 (issue 34) 

Dr. Stuart Hatcher

Dr. Stuart Hatcher
Chief Economist & ISTAT Certified Senior Appraiser

[email protected] 

Stu's view:

第2四半期のキャパシティ結果はかなり良好

先週の第 3 四半期のキャパシティ・レビューに続き、第 2 四半期の実際の第2四半期の実際のキャパシティを振り返ってみましょう。というのも、堅調な見通しは、需要不足、機材不足、労働力不足によって簡単に覆される可能性があるからです。


以下の最初のグラフが示すように、実際のキャパシティは、昨年のベースが低かったため、2022 年と比較して、北米とラテンアメリカの間の 9% からアジア太平洋地域内の 88% まで、全体的に増加しました。後者の場合、アジアの航空会社が第2四半期の数字を公表することに消極的であったため、これは公表された予定キャパシティとは対照的です。


公表されたスケジュールに基づく推計では、アジア太平洋域内のキャパシティは44%増加するとされていましたが、実際の数値はその 2 倍近くでした。対照的に、太平洋横断便のキャパシティは88%増加すると予想されていましたが、実際の数字は 34% 近くでした。しかし、最も対照的だったのは、2022年第2四半期の実績をわずかに下回ると予想されたヨーロッパ・アジア太平洋間のキャパシティで、最終的な数値は60%の増加を示しています。


相対的に見ると、ヨーロッパ-アジア間のキャパシティの増加は、ほぼ全体的に見られ、上位25社のうち2022年の水準を下回っているのは中国国際航空のみです。相対的に最も増加したのは、キャセイパシフィック航空、大韓航空、アシアナ航空、中国南方航空、ブリティッシュ・エアウェイズで、いずれも22年第2四半期比で100%以上の増加となっています。
 

Source: IBA Insight & Intelligence


2022年同様、トルコ航空は、ヨーロッパとアジア太平洋間の航空便で引き続き首位を維持しており、2019年と比較して成長を示している珍しい航空会社の1つです。上位25位にはエバー航空(54%)、オーストラリア航空(26%)、エアインディア(5%)だけが加わっています。 ルフトハンザドイツ航空、ブリティッシュ・エアウェイズ、エールフランス航空、タイ国際航空、KLMオランダ航空、キャセイパシフィック航空、フィンエアーなどの他の航空会社は、第2四半期の2019年の数字と比較して30-40%の差をつけ続けているが、この路線のキャパシティ全体のかなりの部分を占めています。 ルフトハンザドイツ航空はもともと、2019年にヨーロッパ-アジア間のキャパシティでかなりの差をつけてトップの座を占めていましたが、現在は3位にとどまっています。我々は、これらの航空会社がより多くのキャパシティを追加することを期待する一方で、タイ国際航空のような大きな成長意欲を持つ他の航空会社との路線における競争は、バランスを揺るがす可能性があると予想します。


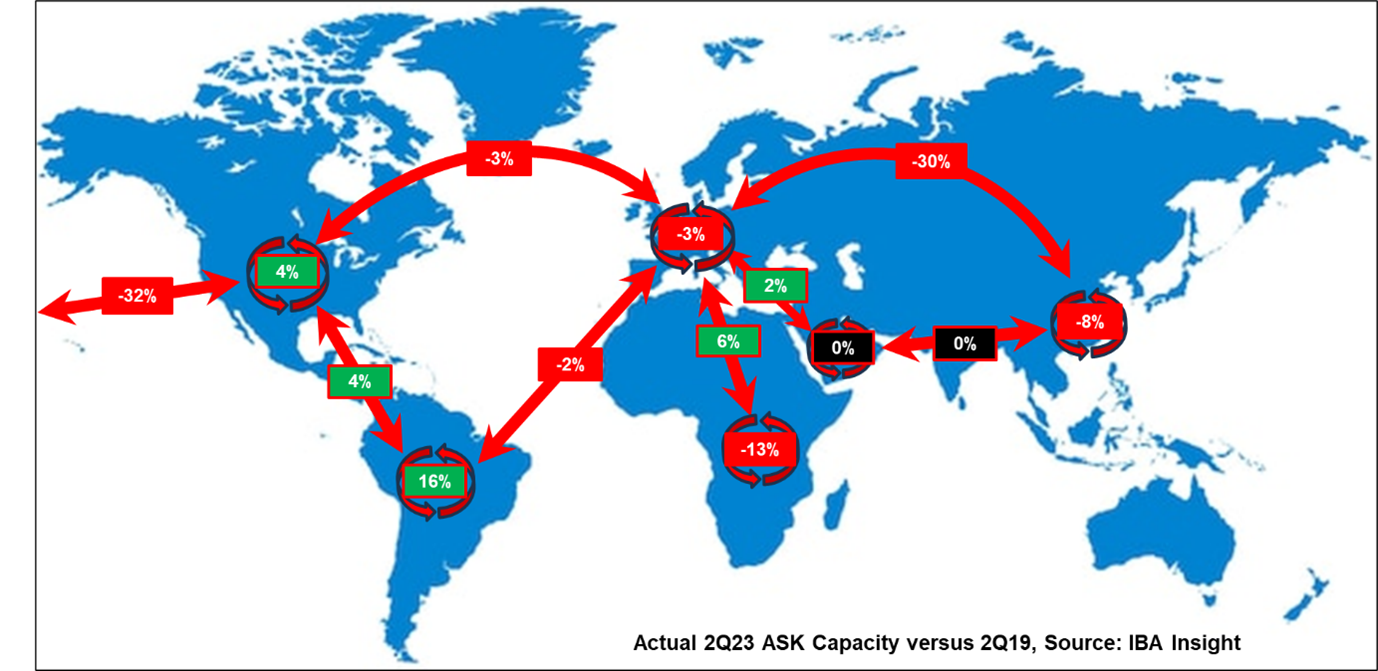
これを 2023 年から 2019 年の比較のうち、これを地図上にプロットしてみると、ほとんどの地域と路線が赤字である一方、少数の地域と路線が控えめな規模での成長を示すために奮闘しているという、より身近なストーリーが見えてきます。 予想通り、南北アメリカ全土のすべての国内およびリージョナル内路線のキャパシティは増加を示しましたが、大西洋を横断する交通量はまだそこまで達していませんが、それに近づいています。 先週取り上げたように、ラテンアメリカは依然として最も強気です。 アフリカとヨーロッパ間の輸送能力も現在では 2019 年のキャパシティを超えており、これに欧州と中東が加わり、その境界線をわずかに超えてきました。


世界的に見ると、この数字はより印象的です。 2023と2022を比較すると、キャパシティは約30%増加しましたが、2019年の同時期と比較すると、まだ4.5%の差にとどまっています。夏の繁忙期を控え、スケジュールと実績の比較が試されます。 前四半期と同様に、一部の航空会社が数字を公表したがらないため、アジア路線はまだ取りこぼしが予想されると予想していますが、上位 25 路線のほとんどからはステップアップすると予想しています。しかし、私自身の短期キャンセルの経験から判断すると、当面は競合他社を意識しながらイールドマネジメントを導入するよう指示する可能性が高いと思います。
 

Source: IBA Insight & Intelligence


Neil Fraser
Manager - Airline Analysis

[email protected]

Is the A380 becoming relevant again?

When in December 2021 Emirates took the last delivery of an A380, most took that as a signal of the beginning of the end for the ‘superjumbo’. UK start-up, Global Airlines, is now putting that into question by launching an exclusively A380 airline. Having acquired three more A380s on the secondary market this week, their total reaches four, with them hoping to start operations in spring 2024.


At the announcement of the end of the program, most carriers adjusted orders to the A350 and A330neo which offer greater fuel efficiency, but lower seat capacity. In single class, an A350 can get to 480 seats (440 for A330) whilst an A380 can get to over 850. Boeing are also lacking in higher capacity aircraft still in production.


The question, therefore, arises whether there is still demand for larger widebodies. The largest client is by far Emirates with their 118 in-service A380s representing 51% of the global fleet. Alongside the 777, the A380 has been fundamental to their transit traffic long-haul business model. With widebody traffic finally recovering, this led them to a record net profit margin of 9.9% in FY22/23.


Perhaps the greatest value of large widebodies is around slot constrained airports, however. To meet demand, sometimes up gauging necessitates widebodies to be run, even on short-haul routes. Global Airlines’ decision, as a UK airline, may be partly motivated by five of the top 10 revenue generating routes (in 2019) involving London Heathrow.


There are of course drawbacks to the A380. As a quad-jet, the aircraft has worse emissions per-seat per-mile than even current-generation narrowbodies (analysed with IBA’s NetZero platform). The A380 in a typical configuration will emit 176g CO2 per-seat per-mile compared with 130g by a 787 (the widebody with the lowest emissions). Some nations such as Israel have used this as a reason to ban quad-jets this year. It is also worth noting that only 140 airports have sufficient length runways to accommodate the A380 (7.3% of global international airports). This will place a ceiling on Global Airlines’ future growth if the emission fees and fuel economy do not already.


At this stage, it is unclear what sort of product Global Airlines will be offering. One of the final challenges of taking over A380s is the refurbishment costs. Singapore’s refurbishment of 14 x A380s in 2017 came at a cost of $61m each and Global Airlines will have this extra expense to consider. This can of course work both ways though. Full-service carriers that rely on the highest quality product may move out the type to avoid this cost. The average age of the type is 9.6 years, and that decision may be arriving soon for many operators, pulling down the price. There may still be economic life for the type, yet.


Luisa Barnes
Aviation Analyst - ESG

[email protected]

Battery limitations impede the environmental efficacy of an all-electric passenger aircraft

Aerospace company Tecnam have put on hold the development of their all-electric passenger aircraft ‘P-Volt’. The aircraft was supposed to be put into service in 2026 on domestic routes in Norway, but battery limitations have hindered its commercial viability. After extensive research, it was concluded that battery technology is not advanced enough to be an operational reality. Tecnam conducted three years of research on the entire lifecycle of the all-electric aircraft and determined that after only a few hundred flights the operator would have to replace the battery. The slow charging and undercharging of the battery mean that the lifecycle emissions from production and operations are deficient.


However, not all electric aircraft manufacturers have experienced technological downfalls. It was announced at the Paris Airshow that Miami-based AeroLease had signed a letter of intent to purchase 50 Eviation Alice electric aircraft, ZeroAvia announced multiple deals including a large order from California-based Flyshare for 250 hydrogen-electric turboprops, alongside various other deals, collaborations, and investments. Current electric aircraft are limited by a short-range and low seat capacity and will be accommodating mainly regional flights with limited passengers.


With international short- and long-haul flights the main cause of emissions in aviation, and electric aircraft energy density currently unable to serve these routes (and unlikely to within the next 20 years), IBA question whether electric aircraft investments should be a priority area in decarbonisation strategies. If electric aircraft will be a focus for regional travel that can be achieved via rail transport, then government investments should be for enhancing efficient and cost-effective rail transport instead.


Suleiman Atif
Aviation Analyst

[email protected]

Market Update

Our weekly update looks at the key trends and market indicators using data and analytics provided by IBA Insight.


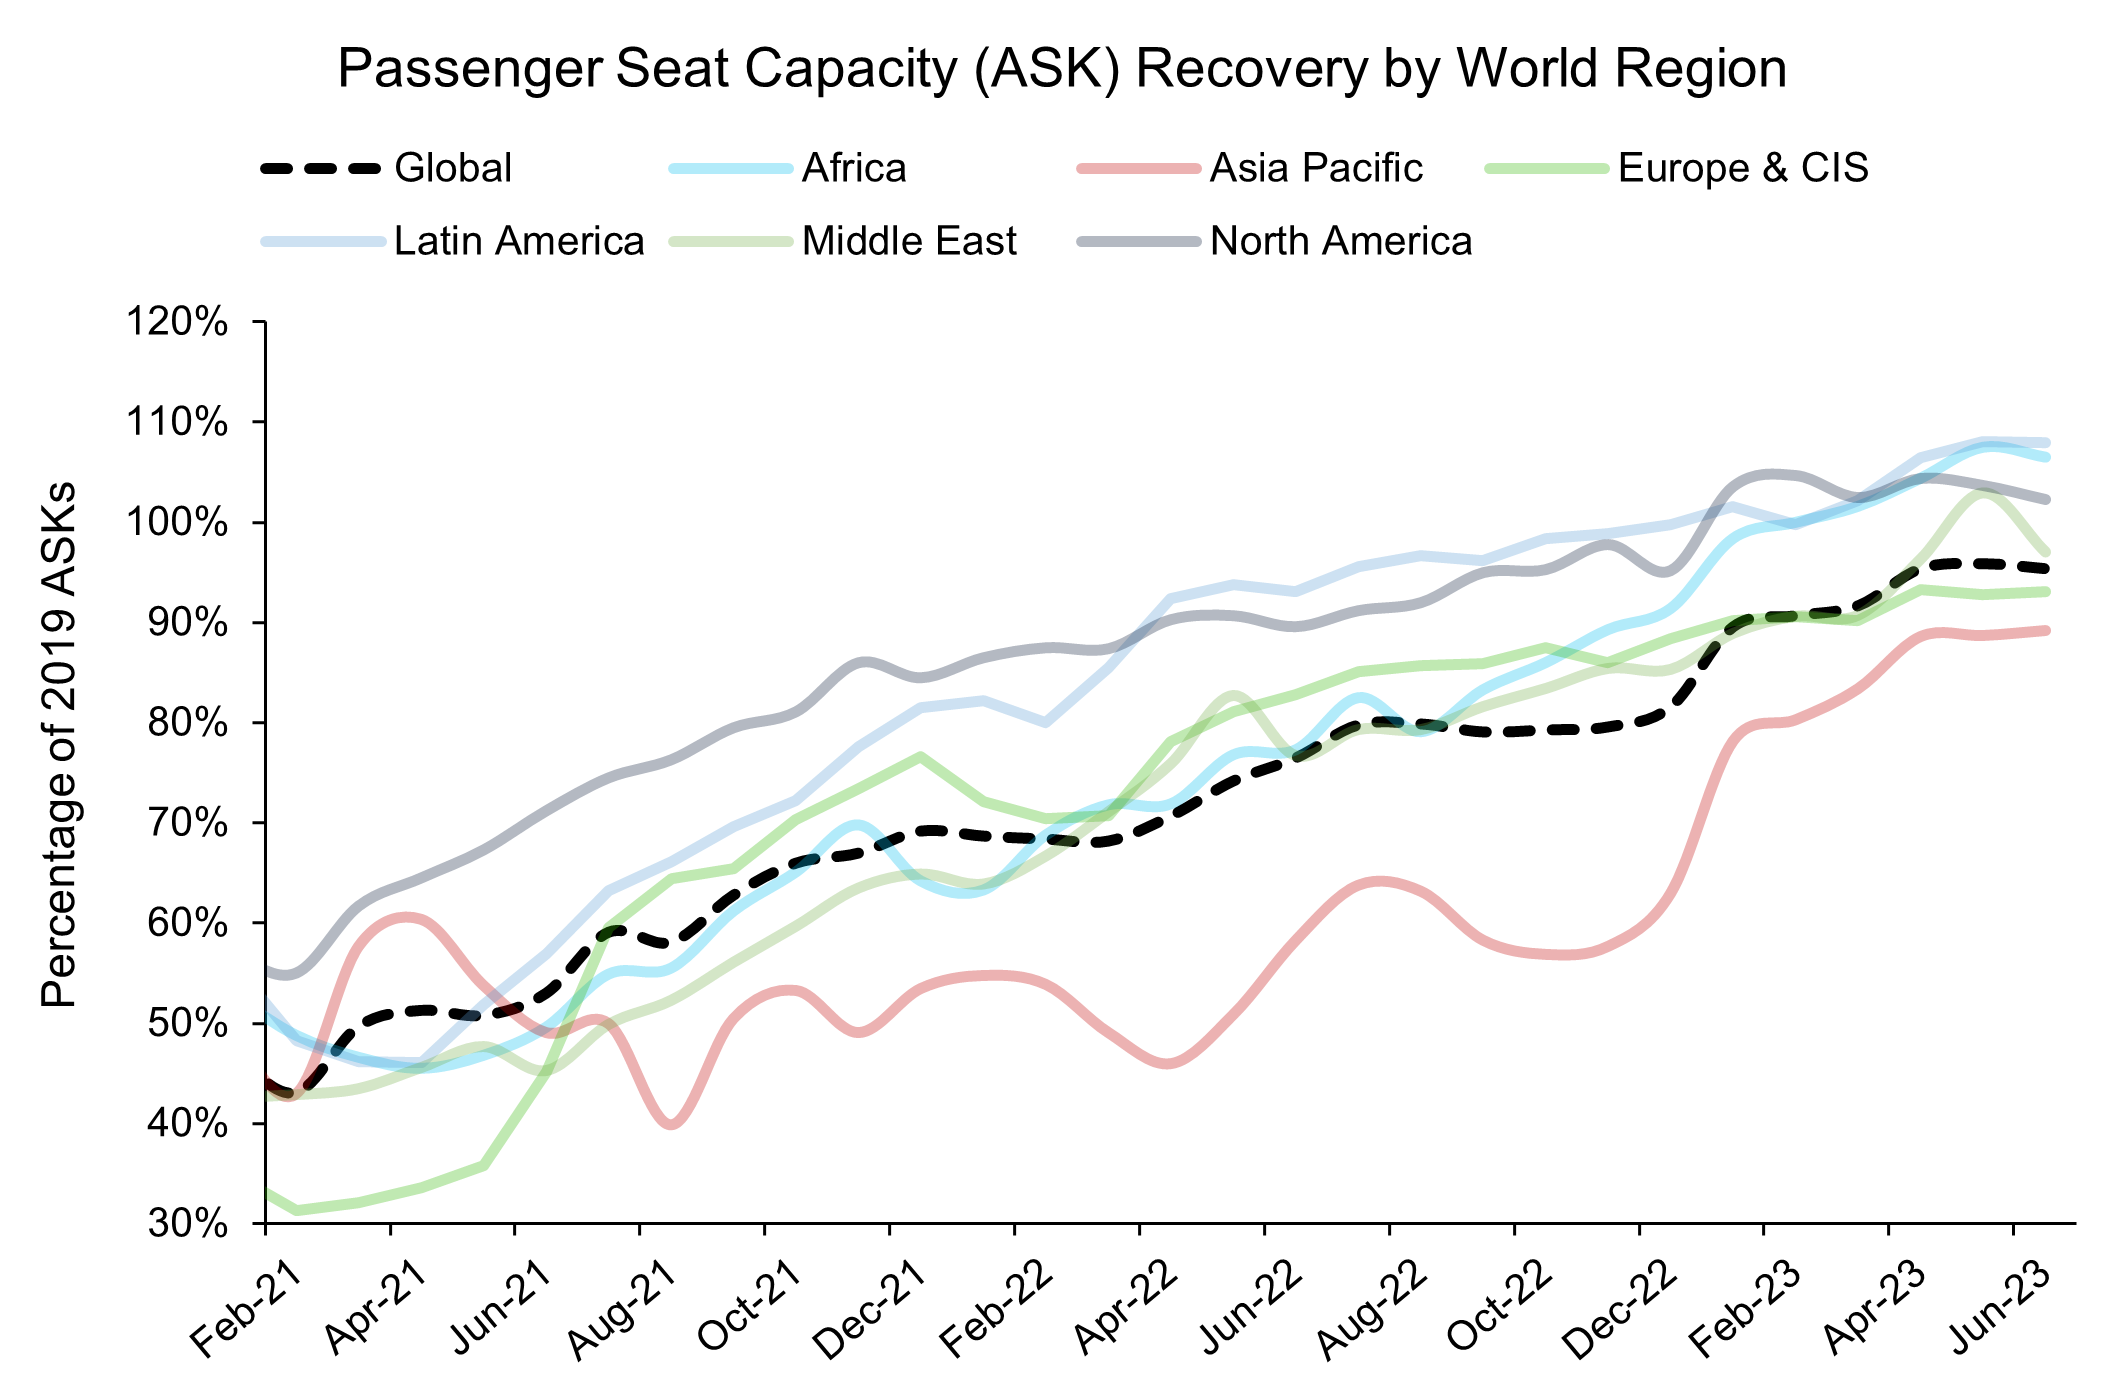
Figure 1: Passenger capacity recovery by region

Source: IBA Insight & Intelligence

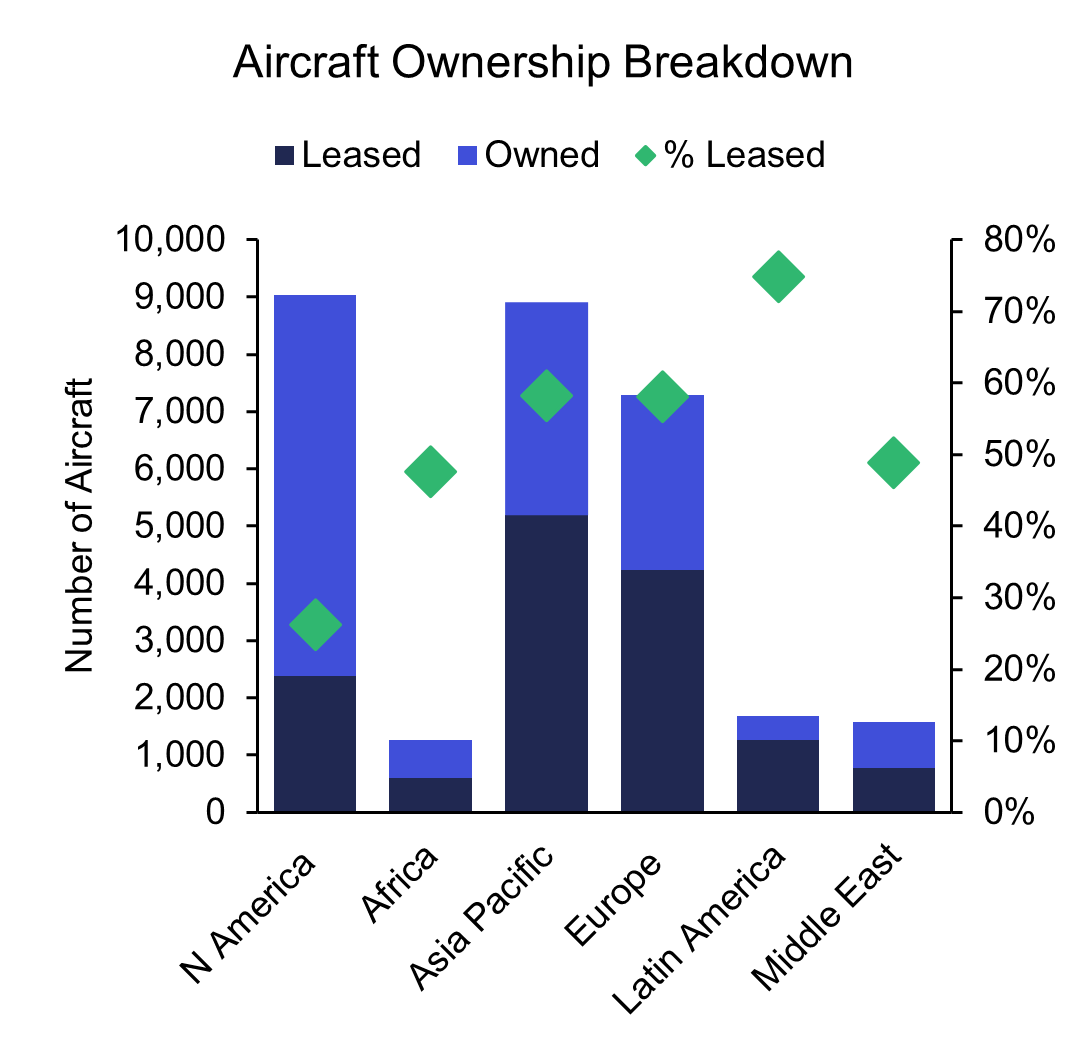
Figure 2: Ownership/leasing insights by region

Source: IBA Insight & Intelligence
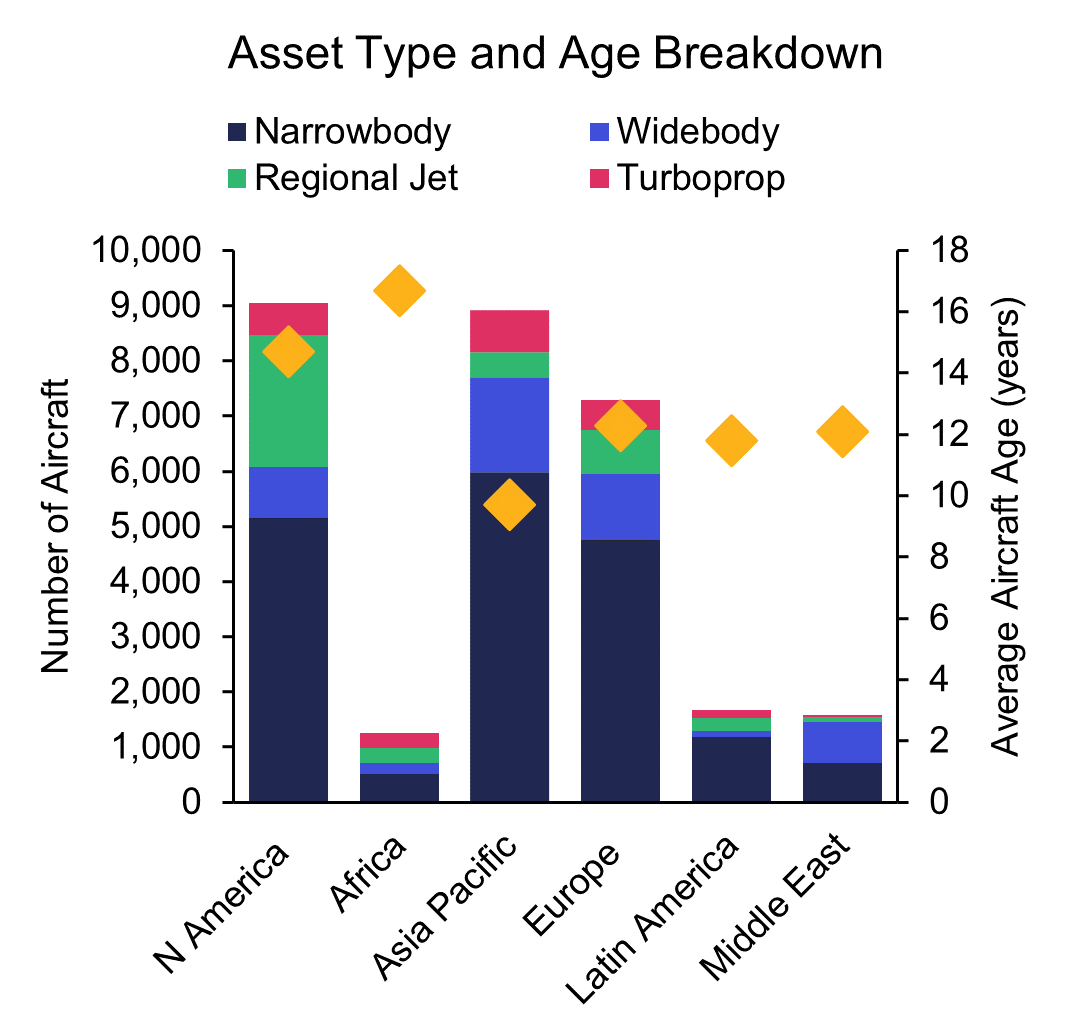
Figure 3: Asset insights by region

Source: IBA Insight & Intelligence


Download to PDF

100%

主要な航空機およびエンジンOEMすべて(100%)に関しアドバイスを提供

100

上位100社の銀行、貸手、航空会社にアドバイスを提供

35+

独自の評価と整備データの年数

100+

サービス管理契約を締結している航空機数

IBA Weekly  Download to PDF

Date: 07/07/2023 (issue 34) 

Dr. Stuart Hatcher

Dr. Stuart Hatcher
Chief Economist & ISTAT Certified Senior Appraiser

[email protected] 

Stu's view:

Q2 capacity results looked pretty good

Moving on from last week’s Q3 scheduled capacity review, it’s time to reflect on how actual seat capacity performed during the second quarter, as bullish sentiment can easily be pushed aside by a lack of demand, or from aircraft and labour shortages.


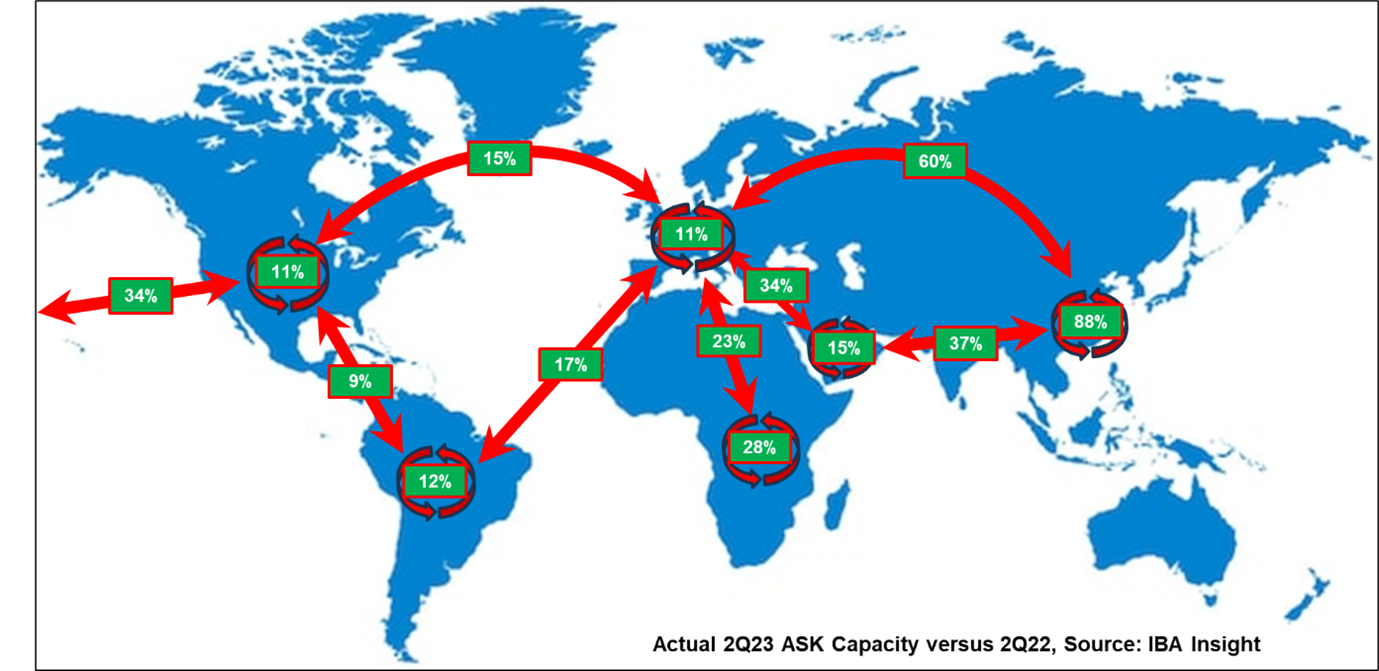
As the first chart below indicates, actual capacity increased compared to 2022 across the board ranging from 9% between North America and Latin America to 88% for intra-Asia Pacific due to the low base last year. For the case of the latter, this is a stark contrast to published scheduled capacity due to the reluctance of Asian operators to issue figures for Q2 earlier in the year.


Estimations based on published schedules indicated that intra-Asia Pacific capacity would rise 44%, whereas the real number was closer to double that. In contrast, whilst trans-Pacific capacity was expected to rise by as much as 88%, the real number was closer to 34%. The largest contrast occurred, however, for capacity scheduled between Europe and Asia Pacific which indicated that performance would remain marginally lower than that seen in the second quarter of 2022, where in fact the final number shows an increase of 60%.


In relative terms, the increase in capacity between Europe and Asia is largely across the board with only Air China trailing 2022 levels in the top 25. The largest relative increases came from Cathay, Korean, Asiana, China Southern and BA – all at >100% compared to 2Q22.


Source: IBA Insight & Intelligence


As in 2022, THY continues to lead in the flows between Europe and Asia Pacific, one of the odd ones that show growth compared to 2019, joined only by EVA (54%), Virgin (26%) and Air India (5%) in the top 25. Others like Lufthansa, BA, Air France, Thai, KLM, Cathay, and Finnair continue to trail by 30-40% compared to 2019 figures for the second quarter but occupy a significant portion of the overall capacity for the route. Lufthansa originally held the top spot for Europe-Asia capacity back in 2019 with a substantial margin but currently remain in third spot. Whilst we expect them to add more capacity, competition on the routes from others with huge growth aspirations, like THY, could shake up the balance.


Plotting this along with the rest of the 2023-2019 comparison on a map, a more familiar story appears whereby most regions and routes are in the red, whilst a few have fought to illustrate growth on a modest scale. As expected, all domestic and intra-regional capacity across the Americas exhibited capacity growth whilst traffic across the Atlantic is still not quite there yet – but it’s close. Latin America, as covered last week, remains the most bullish. Capacity between Africa and Europe has also exceeded 2019 levels now, joined by Europe-Middle East, which has just nudged over the line.


Globally, the figures are more impressive. When comparing 2Q23 to 2Q22, capacity has grown by approximately 30%, whilst when comparing to the same period in 2019, we are still only adrift by 4.5%. With a busy summer schedule ahead, the comparison of schedules and actuals will be put to the test. As with last quarter, I still expect misses for Asian routes due to the reluctance of some to put their figures out there, but I would expect a step up from most of the top 25. However, judging by my own experiences of short-term cancellations, yield management will dictate that still for most for the time being, with one eye remaining on the competition.


Source: IBA Insight & Intelligence


Neil Fraser
Manager - Airline Analysis

[email protected]

Is the A380 becoming relevant again?

When in December 2021 Emirates took the last delivery of an A380, most took that as a signal of the beginning of the end for the ‘superjumbo’. UK start-up, Global Airlines, is now putting that into question by launching an exclusively A380 airline. Having acquired three more A380s on the secondary market this week, their total reaches four, with them hoping to start operations in spring 2024.


At the announcement of the end of the program, most carriers adjusted orders to the A350 and A330neo which offer greater fuel efficiency, but lower seat capacity. In single class, an A350 can get to 480 seats (440 for A330) whilst an A380 can get to over 850. Boeing are also lacking in higher capacity aircraft still in production.


The question, therefore, arises whether there is still demand for larger widebodies. The largest client is by far Emirates with their 118 in-service A380s representing 51% of the global fleet. Alongside the 777, the A380 has been fundamental to their transit traffic long-haul business model. With widebody traffic finally recovering, this led them to a record net profit margin of 9.9% in FY22/23.


Perhaps the greatest value of large widebodies is around slot constrained airports, however. To meet demand, sometimes up gauging necessitates widebodies to be run, even on short-haul routes. Global Airlines’ decision, as a UK airline, may be partly motivated by five of the top 10 revenue generating routes (in 2019) involving London Heathrow.


There are of course drawbacks to the A380. As a quad-jet, the aircraft has worse emissions per-seat per-mile than even current-generation narrowbodies (analysed with IBA’s NetZero platform). The A380 in a typical configuration will emit 176g CO2 per-seat per-mile compared with 130g by a 787 (the widebody with the lowest emissions). Some nations such as Israel have used this as a reason to ban quad-jets this year. It is also worth noting that only 140 airports have sufficient length runways to accommodate the A380 (7.3% of global international airports). This will place a ceiling on Global Airlines’ future growth if the emission fees and fuel economy do not already.


At this stage, it is unclear what sort of product Global Airlines will be offering. One of the final challenges of taking over A380s is the refurbishment costs. Singapore’s refurbishment of 14 x A380s in 2017 came at a cost of $61m each and Global Airlines will have this extra expense to consider. This can of course work both ways though. Full-service carriers that rely on the highest quality product may move out the type to avoid this cost. The average age of the type is 9.6 years, and that decision may be arriving soon for many operators, pulling down the price. There may still be economic life for the type, yet.


Luisa Barnes
Aviation Analyst - ESG

[email protected]

Battery limitations impede the environmental efficacy of an all-electric passenger aircraft

Aerospace company Tecnam have put on hold the development of their all-electric passenger aircraft ‘P-Volt’. The aircraft was supposed to be put into service in 2026 on domestic routes in Norway, but battery limitations have hindered its commercial viability. After extensive research, it was concluded that battery technology is not advanced enough to be an operational reality. Tecnam conducted three years of research on the entire lifecycle of the all-electric aircraft and determined that after only a few hundred flights the operator would have to replace the battery. The slow charging and undercharging of the battery mean that the lifecycle emissions from production and operations are deficient.


However, not all electric aircraft manufacturers have experienced technological downfalls. It was announced at the Paris Airshow that Miami-based AeroLease had signed a letter of intent to purchase 50 Eviation Alice electric aircraft, ZeroAvia announced multiple deals including a large order from California-based Flyshare for 250 hydrogen-electric turboprops, alongside various other deals, collaborations, and investments. Current electric aircraft are limited by a short-range and low seat capacity and will be accommodating mainly regional flights with limited passengers.


With international short- and long-haul flights the main cause of emissions in aviation, and electric aircraft energy density currently unable to serve these routes (and unlikely to within the next 20 years), IBA question whether electric aircraft investments should be a priority area in decarbonisation strategies. If electric aircraft will be a focus for regional travel that can be achieved via rail transport, then government investments should be for enhancing efficient and cost-effective rail transport instead.


Suleiman Atif
Aviation Analyst

[email protected]

Market Update

Our weekly update looks at the key trends and market indicators using data and analytics provided by IBA Insight.


Figure 1: Passenger capacity recovery by region

Source: IBA Insight & Intelligence

Figure 2: Ownership/leasing insights by region

Source: IBA Insight & Intelligence
Figure 3: Asset insights by region

Source: IBA Insight & Intelligence


Download to PDF


Newsletter sign up