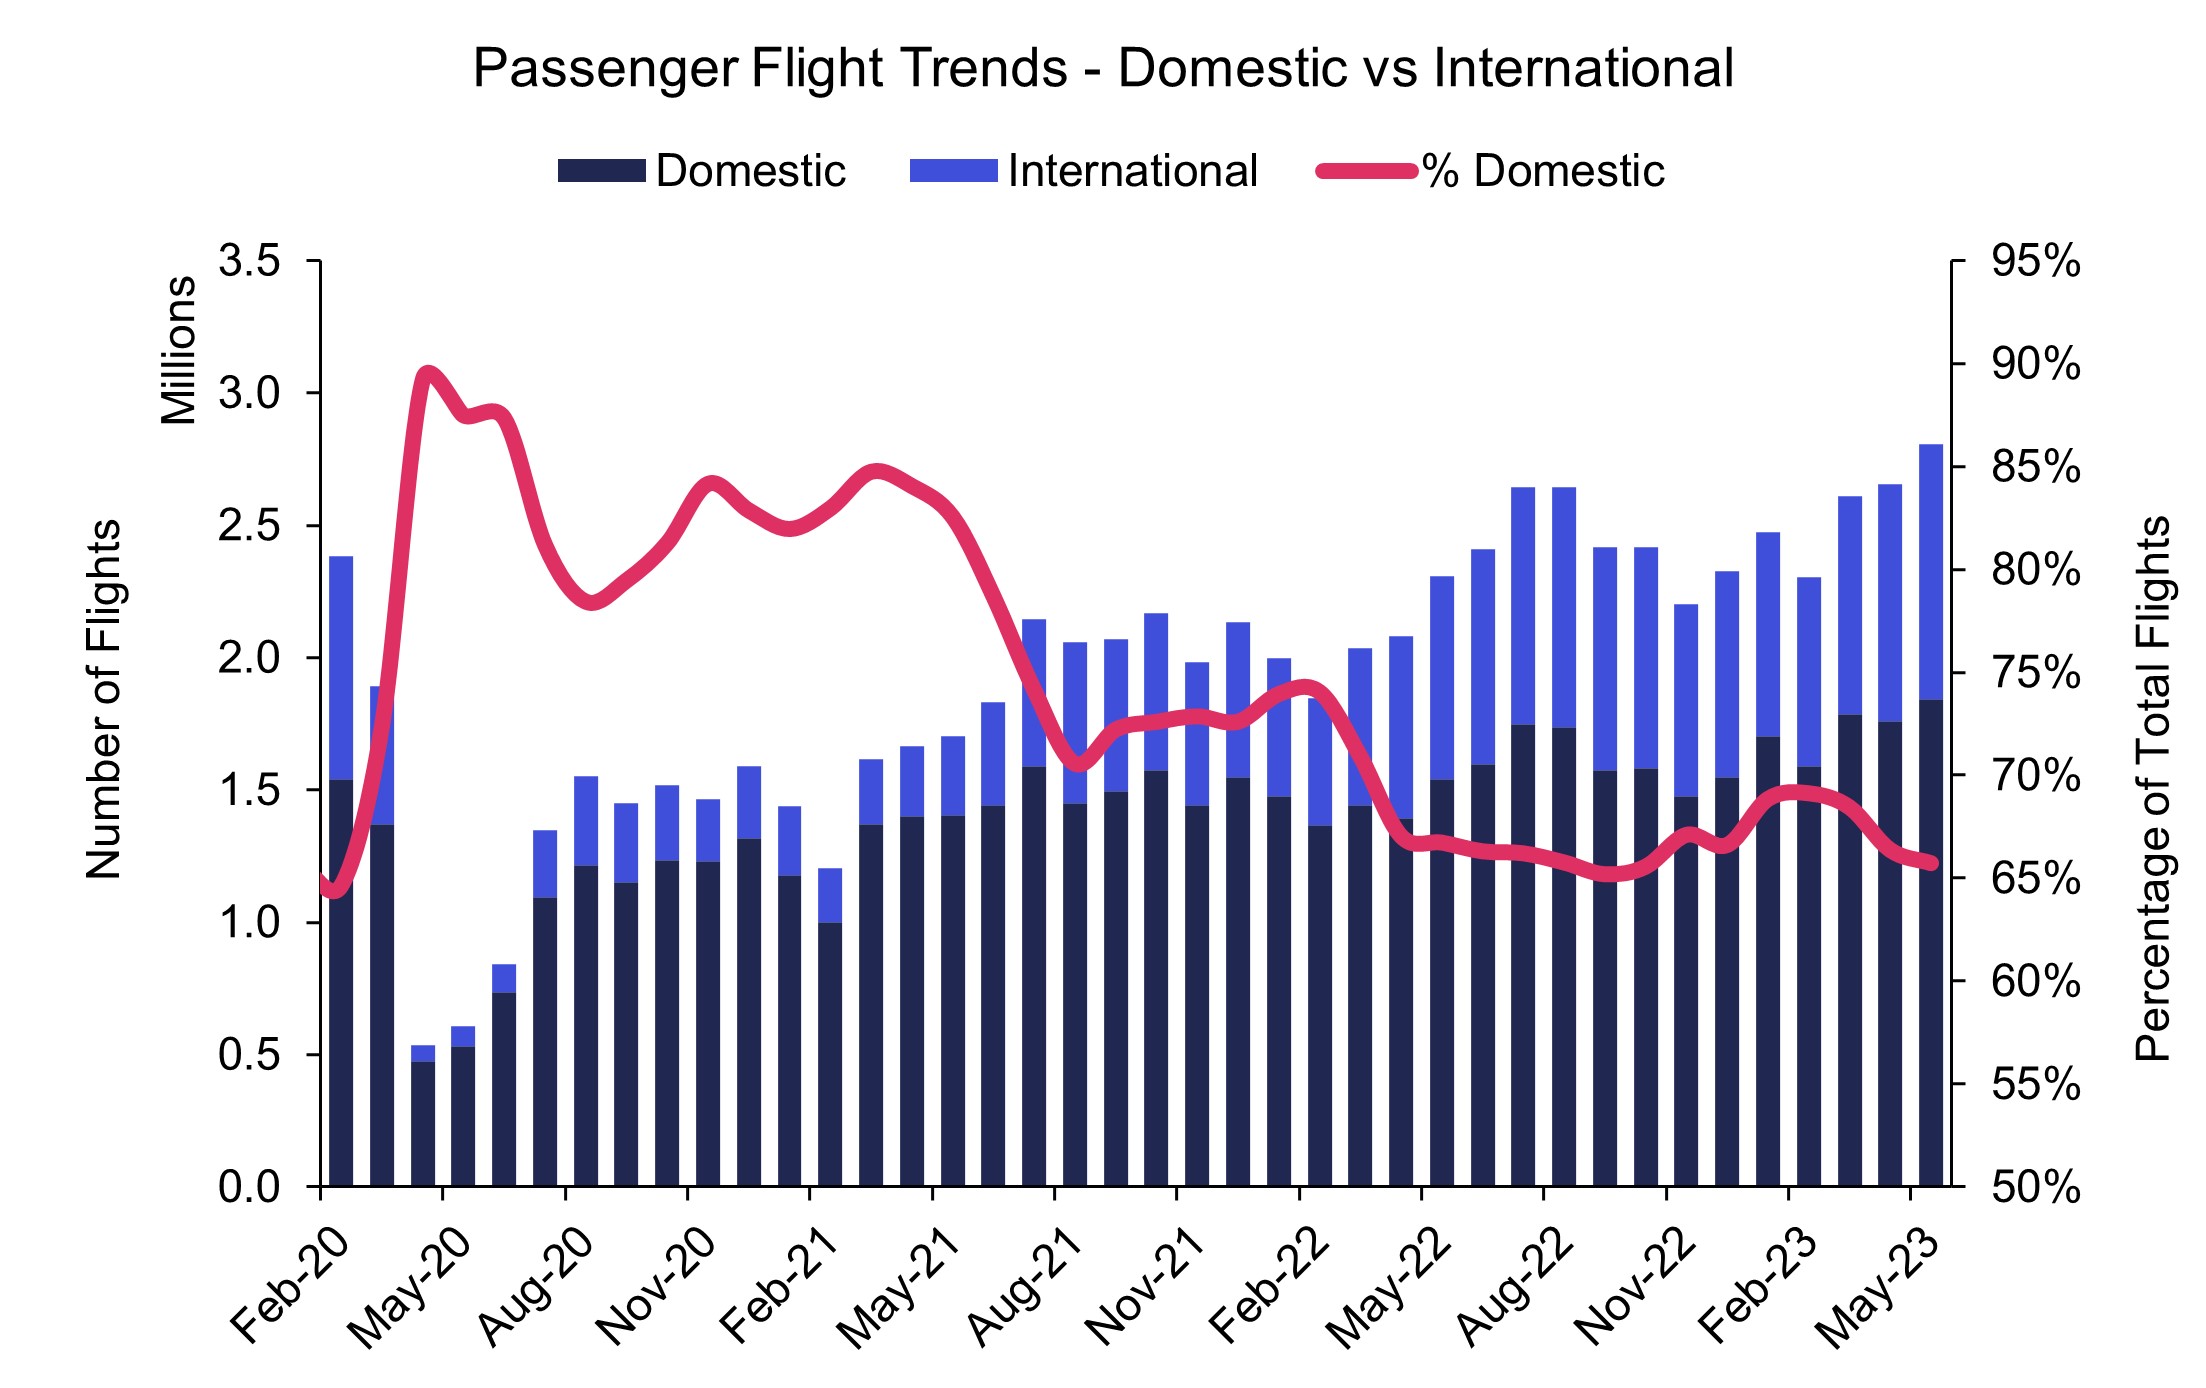
When considering market growth (or recovery), capacity is a good forward indicator. Of course, traffic gives a truer picture, but this is only a trailing indicator. Traffic growth may also not be proportional to capacity, as load factor comes into play. Accordingly, month-on-month operators will adjust capacity to ensure they are getting the best balance of total revenue and profitability.
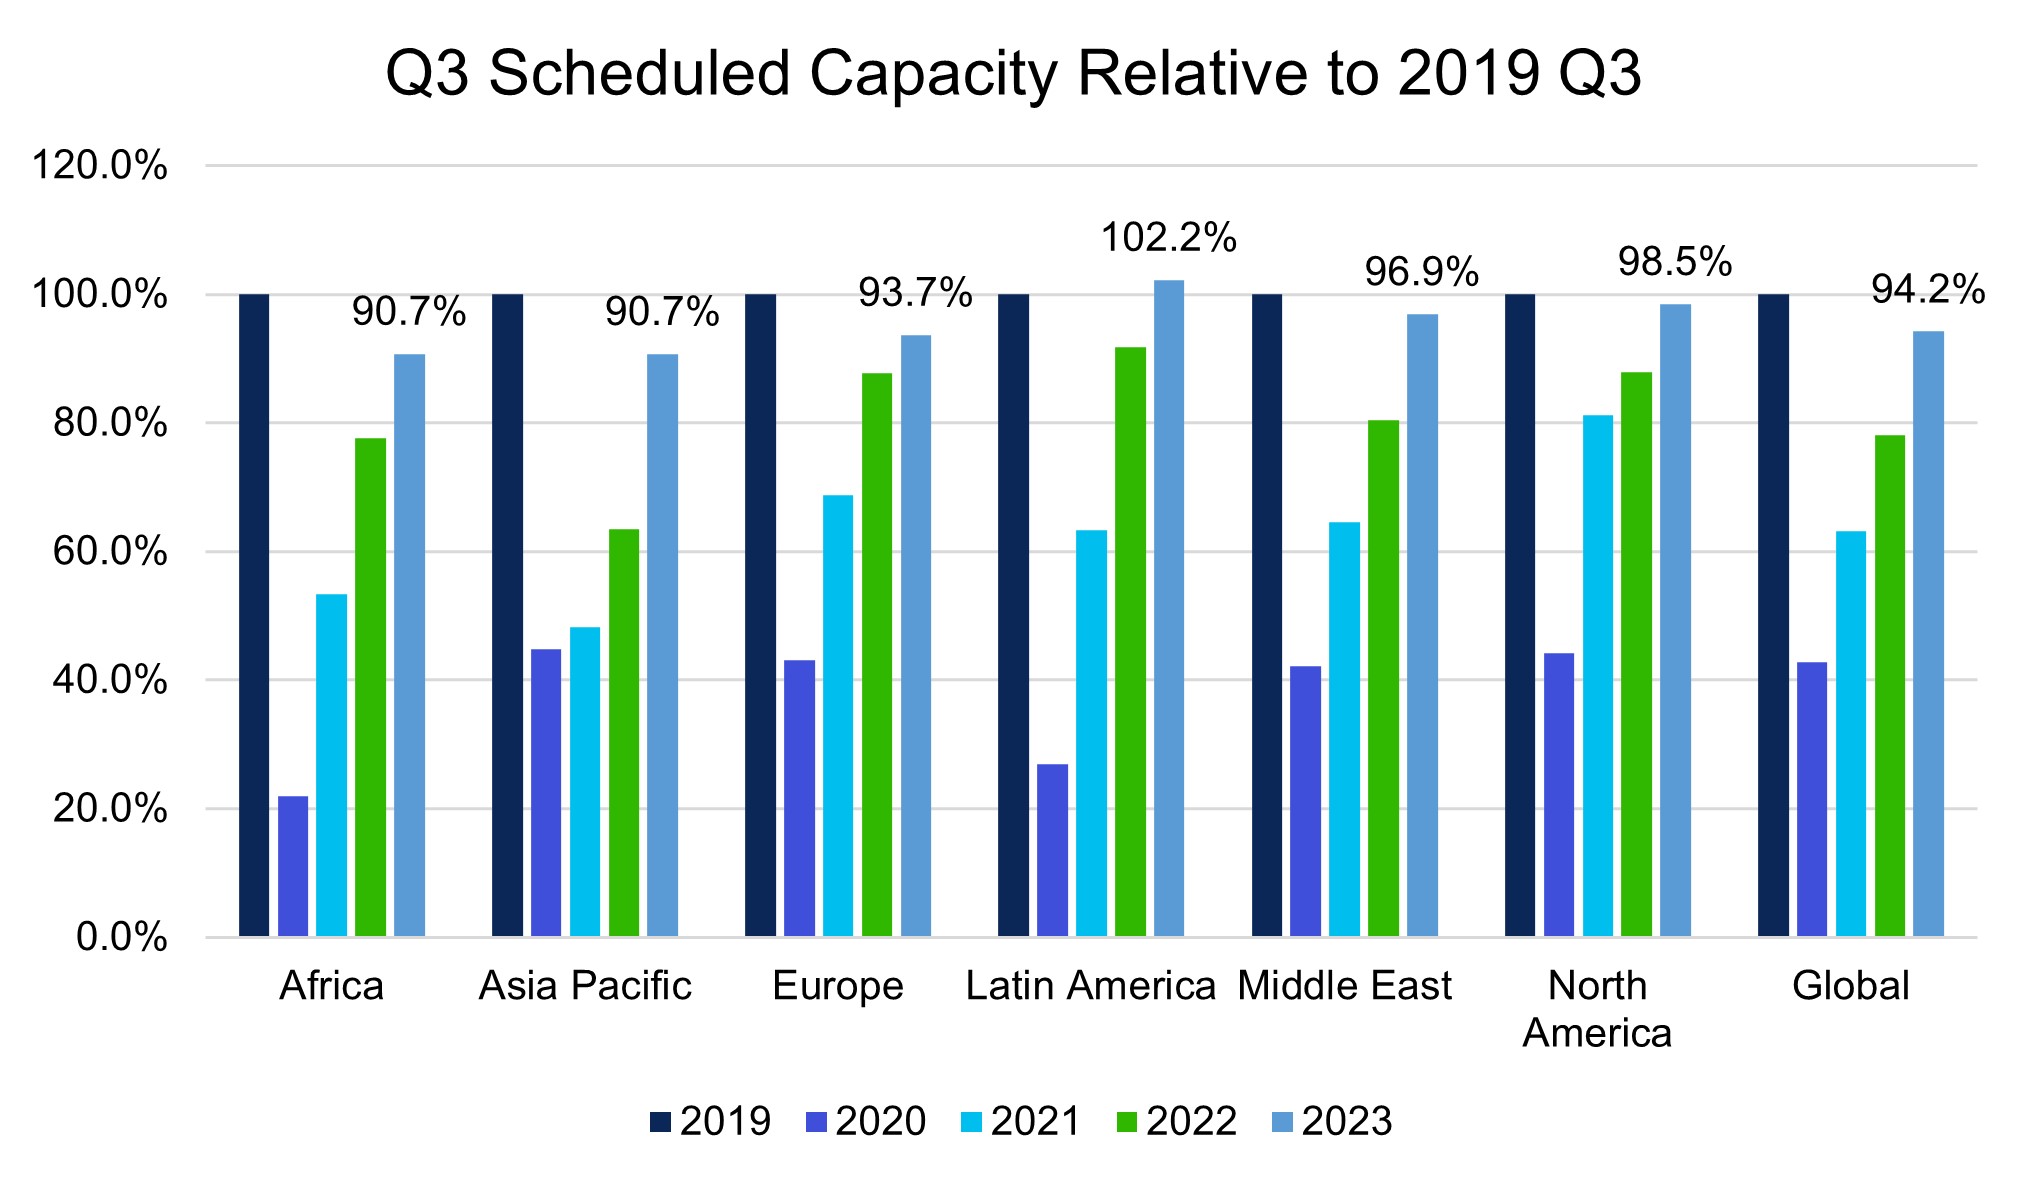
When comparing to previous Q3s we can see that scheduled capacity for the busiest quarter globally is still short even in 2023 (94.2% globally). Whilst everyone expects Asia to pull the average down, only Latin America has scheduled more capacity than in 2019. Asia, in fact, increased their capacity by 43% relative to 2022. The chart below also shows the Middle East’s slower recovery relative to Europe and North America, as there was less demand for long-haul traffic.
As that pattern is reversing, their scheduled capacity now exceeds Europe (96.9% to 93.7%). Interestingly, Europe has only moderately increased capacity year-on-year, by 6.8%. This may be with the airport disruptions in recent years in mind. Although the US is more bullish, despite staff shortages and airport disruptions affecting that region the most.
Interestingly, Europe is the only region to still be adding in Q3 capacity month-on-month. From analysing each monthly schedule update, other regions seem to be settling on this capacity amount or even tapering back. Reducing capacity is a mechanism to maintain price. If we are to get to 2019 capacity levels, we may begin to see the end of the high-fare environment of pent-up demand.

Source: IBA Insight & Intelligence
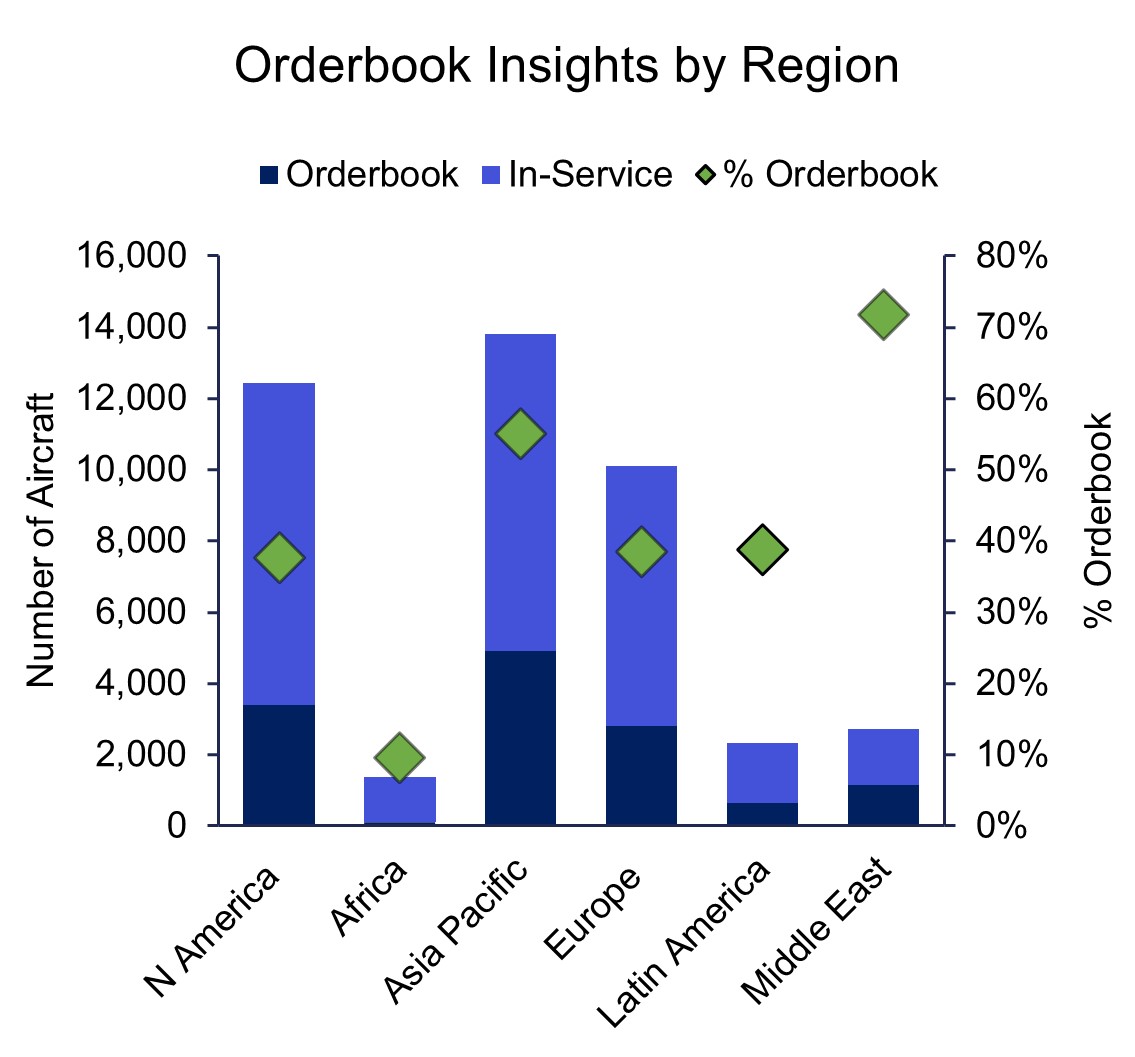
Last week, Indian operators, Air India and IndiGo, were stars of the Paris Air Show with their combined 970 firm aircraft orders. This was 84% of the total firm orders. A frequent question has been whether the market can accommodate the growth, but another question is how these aircraft will be financed. The short answer is leasing. However, until recently, India was not a very accommodating place for lessors. Fifteen years after signing the Cape Town agreement, India is finally drafting a bill to enforce it, attempting to change that reputation.
The Cape Town Agreement, which streamlines the repossession of aircraft in foreign jurisdictions, has a typical resolution timeline of 60 days. By contrast, the average bankruptcy resolution in India takes 600 days. This is particularly galling to lessors when entities like Go First can restart in a matter of weeks without having resolved their creditors’ claims.
This is an important step for Indian operators as 74% of the total Indian fleet is leased, 90% in the case of IndiGo. Air India have the cash injections of the Tata Group to perhaps help them buy aircraft, but IndiGo’s 985 aircraft backlog will be heavily reliant on Sale-and-Leaseback transactions. This is also the case with new growing airlines, such as Akasa Air.
The large scale of the orders allows the airlines superior purchase prices. If then committing to a Sale-and-Leaseback transaction for smaller quantities of aircraft, the aircraft can be transacted back to a lessor at a higher price. As well as greatly reducing the initial cash outlay, this even locks in a profit for the carrier at the start of the lease. In recent large narrowbody transactions, this is estimated to be in the order of 2 years’ worth of lease rentals.
With a superior repossession mechanism, lessors are essentially taking on less risk. They can then reflect this in their rental pricing, enabling greater profitability and, by extension, growth for Indian operators. Ironically, with fewer loopholes for the government to protect the Indian operators, the carriers may be less willing to take on the risk.

Source: IBA Insight & Intelligence

Source: IBA Insight & Intelligence

Source: IBA Insight & Intelligence