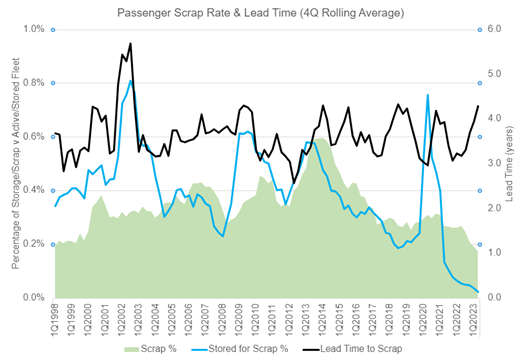
It seems remarkable that given the rollercoaster movement of storage over the past three years, scrap rates remain so low, especially when we consider prior periods of demand collapse. However, when we look at the average lead time between final storage and tear-down over the past three downturns, it would suggest that this side of the market has an element of order to it whilst the storage associated with it is more volatile.
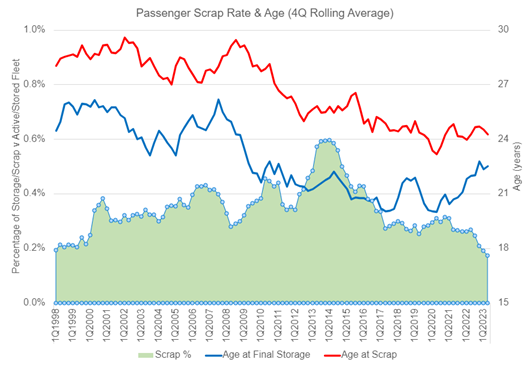
In the charts below, I have presented several metrics to illustrate the scrap rates for passenger aircraft over the past 25 years. These metrics cover the scrap % compared to the remaining fleet, the point at which aircraft are stored that are subsequently scrapped, and the ages involved. All data has been presented as a four-quarter rolling average.

Source: IBA Insight & Intelligence

Source: IBA Insight & Intelligence
Over the past 25 years, there have been ~7,700 passenger aircraft torn down for parts, of which 57% have been Airbus & Boeing aircraft. From the solid green line, we can see that there have been peaks of activity in 2000, 2006, 2010, 2013/2014 and 2020. In fact, the activity surrounding the peak in 2013/2014 (from 2012 to 2016) involved the teardown of just under 30% of all aircraft scrapped over the entire 25-year period, yet the rate has subsequently halved.
Timings of these peaks don’t align particularly well with demand collapse, as even the 2020 peak tops before the full effect of the global shutdown kicks in. It is therefore more important to assess the point at which these aircraft became inactive (the blue line). This metric does not merely indicate storage activity, but the one-way storage activity of aircraft that have subsequently been torn down, in which case the peaks correspond with demand collapses in 9/11, the GFC and the Covid pandemic. From this, we can deduce the average lead times between storage and scrap, which despite some deviation in 2001 and 2012 has remained largely ordered between three and four years. So, the scrap fallout of 9/11 didn’t fully materialise until the peak of 2006, and 2013/14 for the GFC. Whilst there was a spike of storage for scrap activity in 2020, this has been consumed already along with aircraft already in storage maintaining the same lead time trend. By the very nature of the delay in this process, the full fallout from the Covid pandemic has yet to materialise. Whilst the actual number of aircraft already scrapped is known, the stored-for-scrap metric is still growing.
But what drives this? Certainly, the overall growth of the industry building up to demand peaks will accelerate the demand for parts. The growth of the emerging markets has certainly boosted this demand too such that by 2015, pretty much most of what could be torn down had already been earmarked. It was at this point we saw the emergence of stub-lease lessors who were buying up aircraft thought to be on their last lease to maintain a supply into the parts market. In fact, the tear-down trend didn’t continue as the aircraft were more valuable flying such that pricing aircraft for teardown proved volatile. That continues today, whereby the OEMs are unable to keep up with production demand, so the teardowns reduce. The demand is so great, however, that we may see lead times grow beyond the long-term trend.
This is visible when looking at the age at scrap, or more importantly the age at final storage. The key fallout from the GFC was the collapse of final storage ages from 25 years to 22 years which reduced slowly as OEM production rates climbed, to just 20 years at the start of 2020. Of course, this only measures the aircraft torn down and doesn’t reflect on the age of the fleet. But it does highlight the point that there was more value in the parts than in the whole. The evolution of the spare engine business certainly encouraged this shift too. Where the age trend continues beyond 2020 is the main question though. So far, the age at final storage has shifted from 20 to 22.7 illustrating the supply chain problem, but it has yet to consider those aircraft already in storage that have not been torn down. The average age of the current stored fleet is 18.95 years. This is up from 13.20 at the depths of the pandemic so it is possible that we will not see it fall back and dip below 20, but it could stay elevated until OEMs sort their problems out.
For most of the world, 2022 was seen as the first full year outside of the pandemic. However, for China, and their Zero-Covid policy, it was their worst affected year. Subsequently, capacity recovery in China and wider Asia lags the rest of the world. This may now change, with China doubling their allowable capacity to the US over the next two months. This is in addition to immediately increasing the number of countries tour groups can go to from 60 to 130.
Up until July, in Q2 China’s capacity had been fluctuating between 92% and 95% of pre-pandemic levels. In July it was just 7 basis points off full recovery. This is likely in line with IBA’s predictions of the Chinese market having pent-up demand, waiting until the school holidays to realise it. Interestingly, the domestic market exceeds 2019 levels already, at 127%. Therefore, with these recent Chinese government policy movements aiding international traffic, it is extremely likely for Chinese carriers to exceed 2019 H2 performance. In terms of the US routes opening alone, US destinations accounted for approximately 5% of Chinese capacity in 2019. Currently they only account for less than 0.4%: Room for regrowth!
These policy changes will be welcome news for Chinese carriers and countries typically receiving large volumes of Chinese tourists. The big three Chinese carriers were all loss-making in Q1, despite the Chinese New Year capacity push, and are rumoured to still be so in Q2. Fortunately, it was not a universal story in the region, with Cathay Pacific already recording twice 2022’s full-year traffic in H1 2023 to achieve a net profit margin of 9.8%. The capacity levels are still half of Cathay’s 2018 (pre–Hong Kong’s civil unrest) levels as well. This may be a clue to how strong the Chinese carriers can be this year.
In recent months, one of the prominent stories has been the growth of Indian carriers. This was punctuated by the 470 aircraft order from Air India and 500 aircraft order from IndiGo at the Paris Air Show, both firm. As we move on from Q2, Indian carrier results have started to emerge and show the differing challenges from different strategies.
One of the curious stories is SpiceJet recording a Q2 operating profit of US$24.4m (margin 10.2%). This is with the backdrop of many petitions for them to file for insolvency. Charges they have failed to evade through the courts this month include US$7m to Willis Lease in engine leasing fees, as well as a US$70m settlement to a former owner, so that profit may not endure. Nonetheless, at the operational level, they became profitable through scaling back operations and focusing on profitable routes. This questions the strategy of India’s big two fighting for new markets, possibly at a loss.
Fortunately, IndiGo’s last three quarterly results have shown a return to profit, most recently with a very healthy net margin of 18.0%. By contrast, the Air India Group, under Tata Sons, has yet to establish itself in its new form and reportedly lost $1.9bn in FY22/23. Despite the large credit facility from the parent group, the carrier is reportedly looking for $362m in financing to support Pre-Delivery-Payments (PDP) of their blockbuster order. Large orders allow you to lock in delivery slots to reduce future growth uncertainty, but they also come at a cost!
It is also of note that IndiGo is reportedly contemplating a 25-aircraft 787 order. This is following on from a successful trial of wet leasing a Turkish Airlines 777. They may hope to capitalise on Air India’s sluggish recent performance. Although they must be careful that running long-hall traffic doesn’t take them to a similar performance.
Our weekly update looks at the key trends and market indicators using data and analytics provided by IBA Insight.

IBAのワンストップ航空インテリジェンスプラットフォームであるIBA Insightを紹介します。IBAの広範なフリート、価値、市場データと飛行データ、専門家の意見とを組み合わせ、投資、リスクプロファイリング、航空機ポートフォリオの監視に大きな自信と保証を提供します。

受賞歴のあるISTAT認定鑑定士の大規模なチームと 30年以上にわたる独自のデータを活用しているIBAは、価値評価市場のリーダーです。グローバルに活動し、航空機、エンジン、ヘリコプター、貨物機、航空貨物、発着枠、スペアなど、さまざまな資産の価値について、独立した公平な意見とアドバイスを提供しています。お客様の期待を超えるように常に努力しており、IBAの客観的な判断は、融資、資産の回収、商業開発、転売に必要な保証をサポートします。

IBAは、世界中の大手航空機・エンジンリース会社と協力しています。当社の業界知識の深さは、専門家としてのアドバイスにも反映されているので、投資サイクルを通じてお客様をサポートし、お客様の旅のあらゆる段階で自信を与えています。評価、フリートの選定、ポートフォリオ開発からリース終了時の引渡、転売まで、リース期間中のあらゆるリスク評価と資産管理活動において、お客様をサポートします。

航空投資は複雑な問題を抱えていることがあり、多額の金銭的な利害関係が絡んでいるため、運に任せることはできません。初めて投資をされる方でも、市場で実績のある方でも、IBAは資産クラスの複雑さを切り開き、投資機会をよりよく理解するためのお手伝いをいたします。お客様と協力し、ポートフォリオの開発、多様化をサポートし、戦略的なニーズを充足いたします。

IBAは30年以上にわたり、世界的な航空会社や地域の航空会社と協力して、評価やアドバイザリーサービス、航空データインテリジェンス、航空機やエンジンの引渡におけるサポートを提供してきました。世界中の様々な航空プロジェクトに協力して取り組み、クライアントのさらなるリソースの要件を満たし、必要な時にはいつでもどこでもプロジェクト管理のサポートを提供しています。

当社は、訴訟支援と紛争解決に臨機応変なアプローチをとり、クライアントの法的戦略に合わせた思慮深い解決策を見出しています。30年以上にわたる独自の航空データへのアクセス、戦略的M&Aへの定期的な関与、および航空機管理の専門知識により、当事者間の典型的な争点となっている分野に定期的にアクセスできます。IBAは、航空機の損傷や損失に対する保険関連の和解から、貸手と借手の間の紛争、多くの場合、引渡時の紛争に至るまで、様々な側面からクライアントを直接、または法務チームを通じて支援します。